How to value an early-stage listed Biotech company with no revenues? - Part 2
Disclaimer: The objective of this write up is for the reader to understand how financial valuation is done for an early-stage public listed company with no revenues. Krystal biotech, Inc. (KRYS, the ticker symbol), a clinical stage gene-therapy company that leverages its proprietary platform to develop therapeutic interventions for rare genetic skin diseases. This investment appraisal was done 2 years ago before the announcement of the results of pivotal phase 3 trial of B-VEC and the recent approval of FDA for treating Dystrophic Epidermolysis Bullosa. It should not be considered a recommendation for investment and the calculations for the valuation are based on the financial statements of KRYS and the assumptions made by the author. The share price of the company by the end of 2021 was $55 and with the successful outcome of phase 3 trial and FDA approval (Both confidently predicted by me), the share price is currently trading at $119. The re-dosable drug will be sold as Vyjuvek after the FDA approval in 2023. The drug will have a price of $24,250 per vial with a cost of 6,31,000 per patient per year ( Source: Biopharma Drive) and this price is not included in this forecast. The current market cap of the company is $3.08B whilst the market cap during this projection 2 years was $1.24B and hence this is not an up to date projection but it offers the reader of how to value a listed early stage biotech companies with no revenues and imputing the current value, one could easily reach the accurate projection following this article step by step.
Forecasted Earning Per Share (EPS)for KRYS of the years 2021–2030
Ratios to measure the return, profitability, financial and operational efficiency
Krystal Biotech’s (KRYS) consolidated forecasted income statement from 2021–2030
Krystal Biotech, (KRYS) consolidated forecasted balance sheet from 2021–2030
Discounted cash flow
Estimating WACC 2. Forecasting net present value of cash flows 3. Terminal value — Implied enterprise value and share price
WACC
The weighted average cost of capital (WACC) was calculated by estimating the cost of equity and the cost of debt (Table 12). The market value of the equity was calculated by multiplying the stock price with the shares outstanding and the equity value amounted to $1.25 billion. The market value of the total debt is $7.83 million and hence the total capitalisation value is $1.255 billion. From the total capitalisation value, the % of equity cap of 99.4% and the debt cap of 0.6% was calculated. The company is equity funded. Imputing the value of equity, debt and the cash equivalents, enterprise value was calculated, which is of $853 million.
Comparison of parameters for WACC for the drug industry sector from stern database against KRYS
The cost of equity was computed using the capital asset pricing model (CAPM) (Fama & French, 2006). The risk-free rate is the average of the 30-years US treasury bond yield. The expected equity market return is a rounded value from the S&P annual return for the last 30 years, which is of 10.7%. The market risk premium was calculated from the risk-free rate and from the expected equity market return. The beta value for the KRYS was taken as 1.11 from the yahoo finance. Data from stern database shows an average beta of 0.89 for the industry average for the drugs from biotechnology industry (547 companies in the U.S), 0.91 for drugs from pharmaceutical industry (287 companies) and 0.73 for industries specialises in healthcare industries (265 companies).
The industry sector average cost of capital for the biotech drug industry and pharma drug industry are 4.72% and 4.75% respectively. The industry average cost of capital is lower than the estimated cost of capital for KRYS. This is due to the current capital structure of the KYRS which is 99% equity financed and hence warrants a higher cost of capital. The cost of equity is the added market risk premium on the top of the risk-free rate. The cost of debt is computed by topping the risk-free rate with a default risk spread. In this case a default spread of A3 or A — rating for small biotech companies or start-ups with small/medium market caps was taken from the stern database. Generally, the WACC decreases over the years, and this is due to the change in the capital structure of the company as they would use more debts for optimal capital structure and therefore a decrease in beta however, the WACC was kept constant for this forecast period. From the free cash flows and the discount rates, discounted cash flow was calculated for each year till 2030 and the sum of the discounted cash flow was compiled.
DCF analysis of cash flows of KRYS from 2021 to 2030
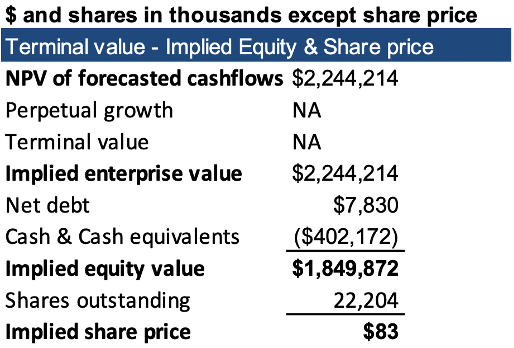
Implied equity and enterprise value of KRYS from 2021 to 2030
Sensitivity analysis
The implied share price of $83 is based on the pricing model valuing $300K for B-VEC and 150K for KB105. The current average palliative cost for the DEB treatment is estimated to be $200 — $400k. In an upside case, aggressive pricing of $400K for BVEC — $200k for KB105 can increase the implied share price value to $114. The recent corporate sheet of KRYS biotech has estimated 125,000 patients worldwide. In these projections, a conservative estimate of 7000 patients in the Europe was used however this number could be larger. Approximately 36,000 patients in the Europe are estimated to have been suffering from different types of EB and hence the revenues can really soar high if KRYS can reach a larger patient population. With their easy to use and one-off shelf topical applying approach, the company may be able to reach the global market with aggressive campaign. With a superior efficacy and a game changer treatment rather the current palliative treatment the company would appease the clinicians and prescribers easily. If the estimated number of 125,000 patients by the company is correct and if they can aggressively reach the global market with a good penetration rate, the B-VEC can be a next blockbuster drug. Moreover, the company can ward off any generic competition once the patent expires in the next decade as it wouldn’t be easy for the generic companies to build gene therapy products and hence re-branding with reduced price can still position the product dominantly in the global market. A sensitivity analysis of implied share price with different price range of both B-VEC and KB105 is described below
Sensitivity analysis to calculate the share price in ($) by imputing range of % of COGS
Sensitivity analysis to calculate the share price by imputing range of % of R&D


